
Analytics ​
Analytics show how reviews, triage, reviewer suggestions and fixes work out for a team, and what the model calls cost. They are team-level by design: there is no ranking, no leaderboard and no per-person view for anyone except the person themself. The exact definition of every metric is in Team analytics.
Who sees what ​
| Where | Who | Content |
|---|---|---|
| Analytics in the sidebar | Organisation administrators | Team metrics, Costs, Teams and Settings for the whole organisation |
| My metrics in the sidebar | Members, when personal metrics are allowed and they opted in | Metrics of their own pull requests and issues |
| The Analytics tab of a repository | Everyone who can see the repository | Team metrics of that repository; model costs for maintainers and administrators |
Read team metrics ​
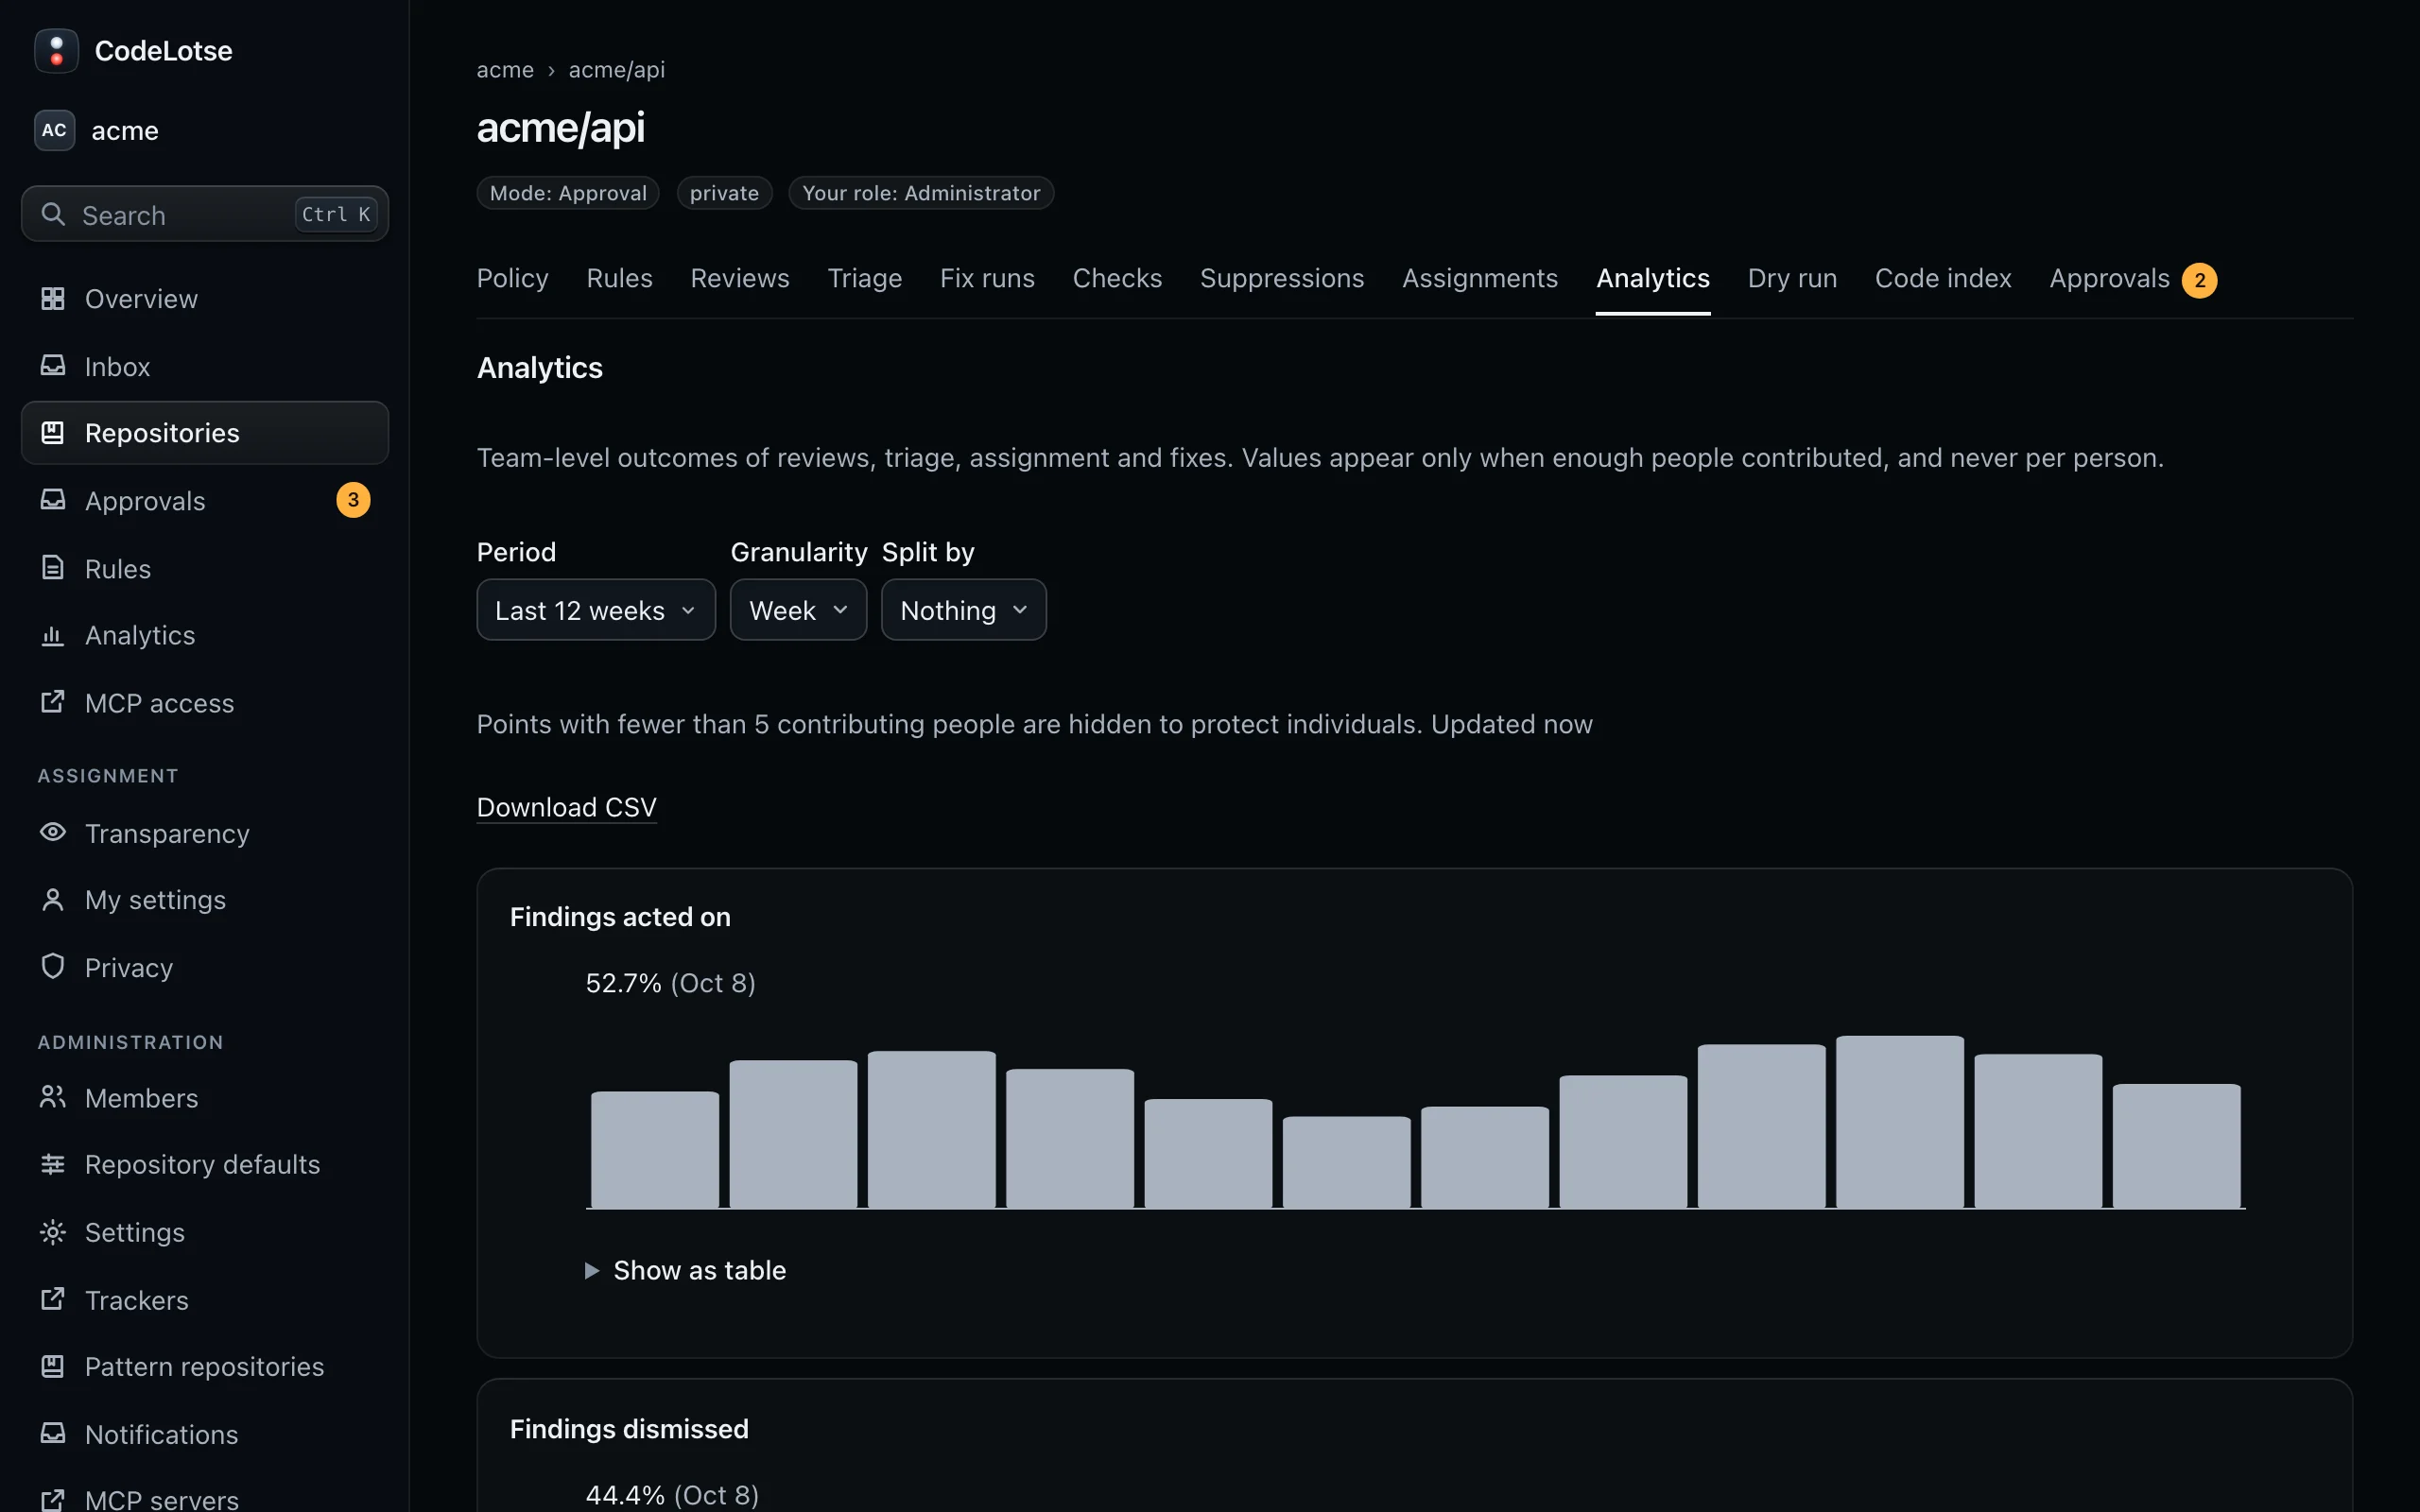
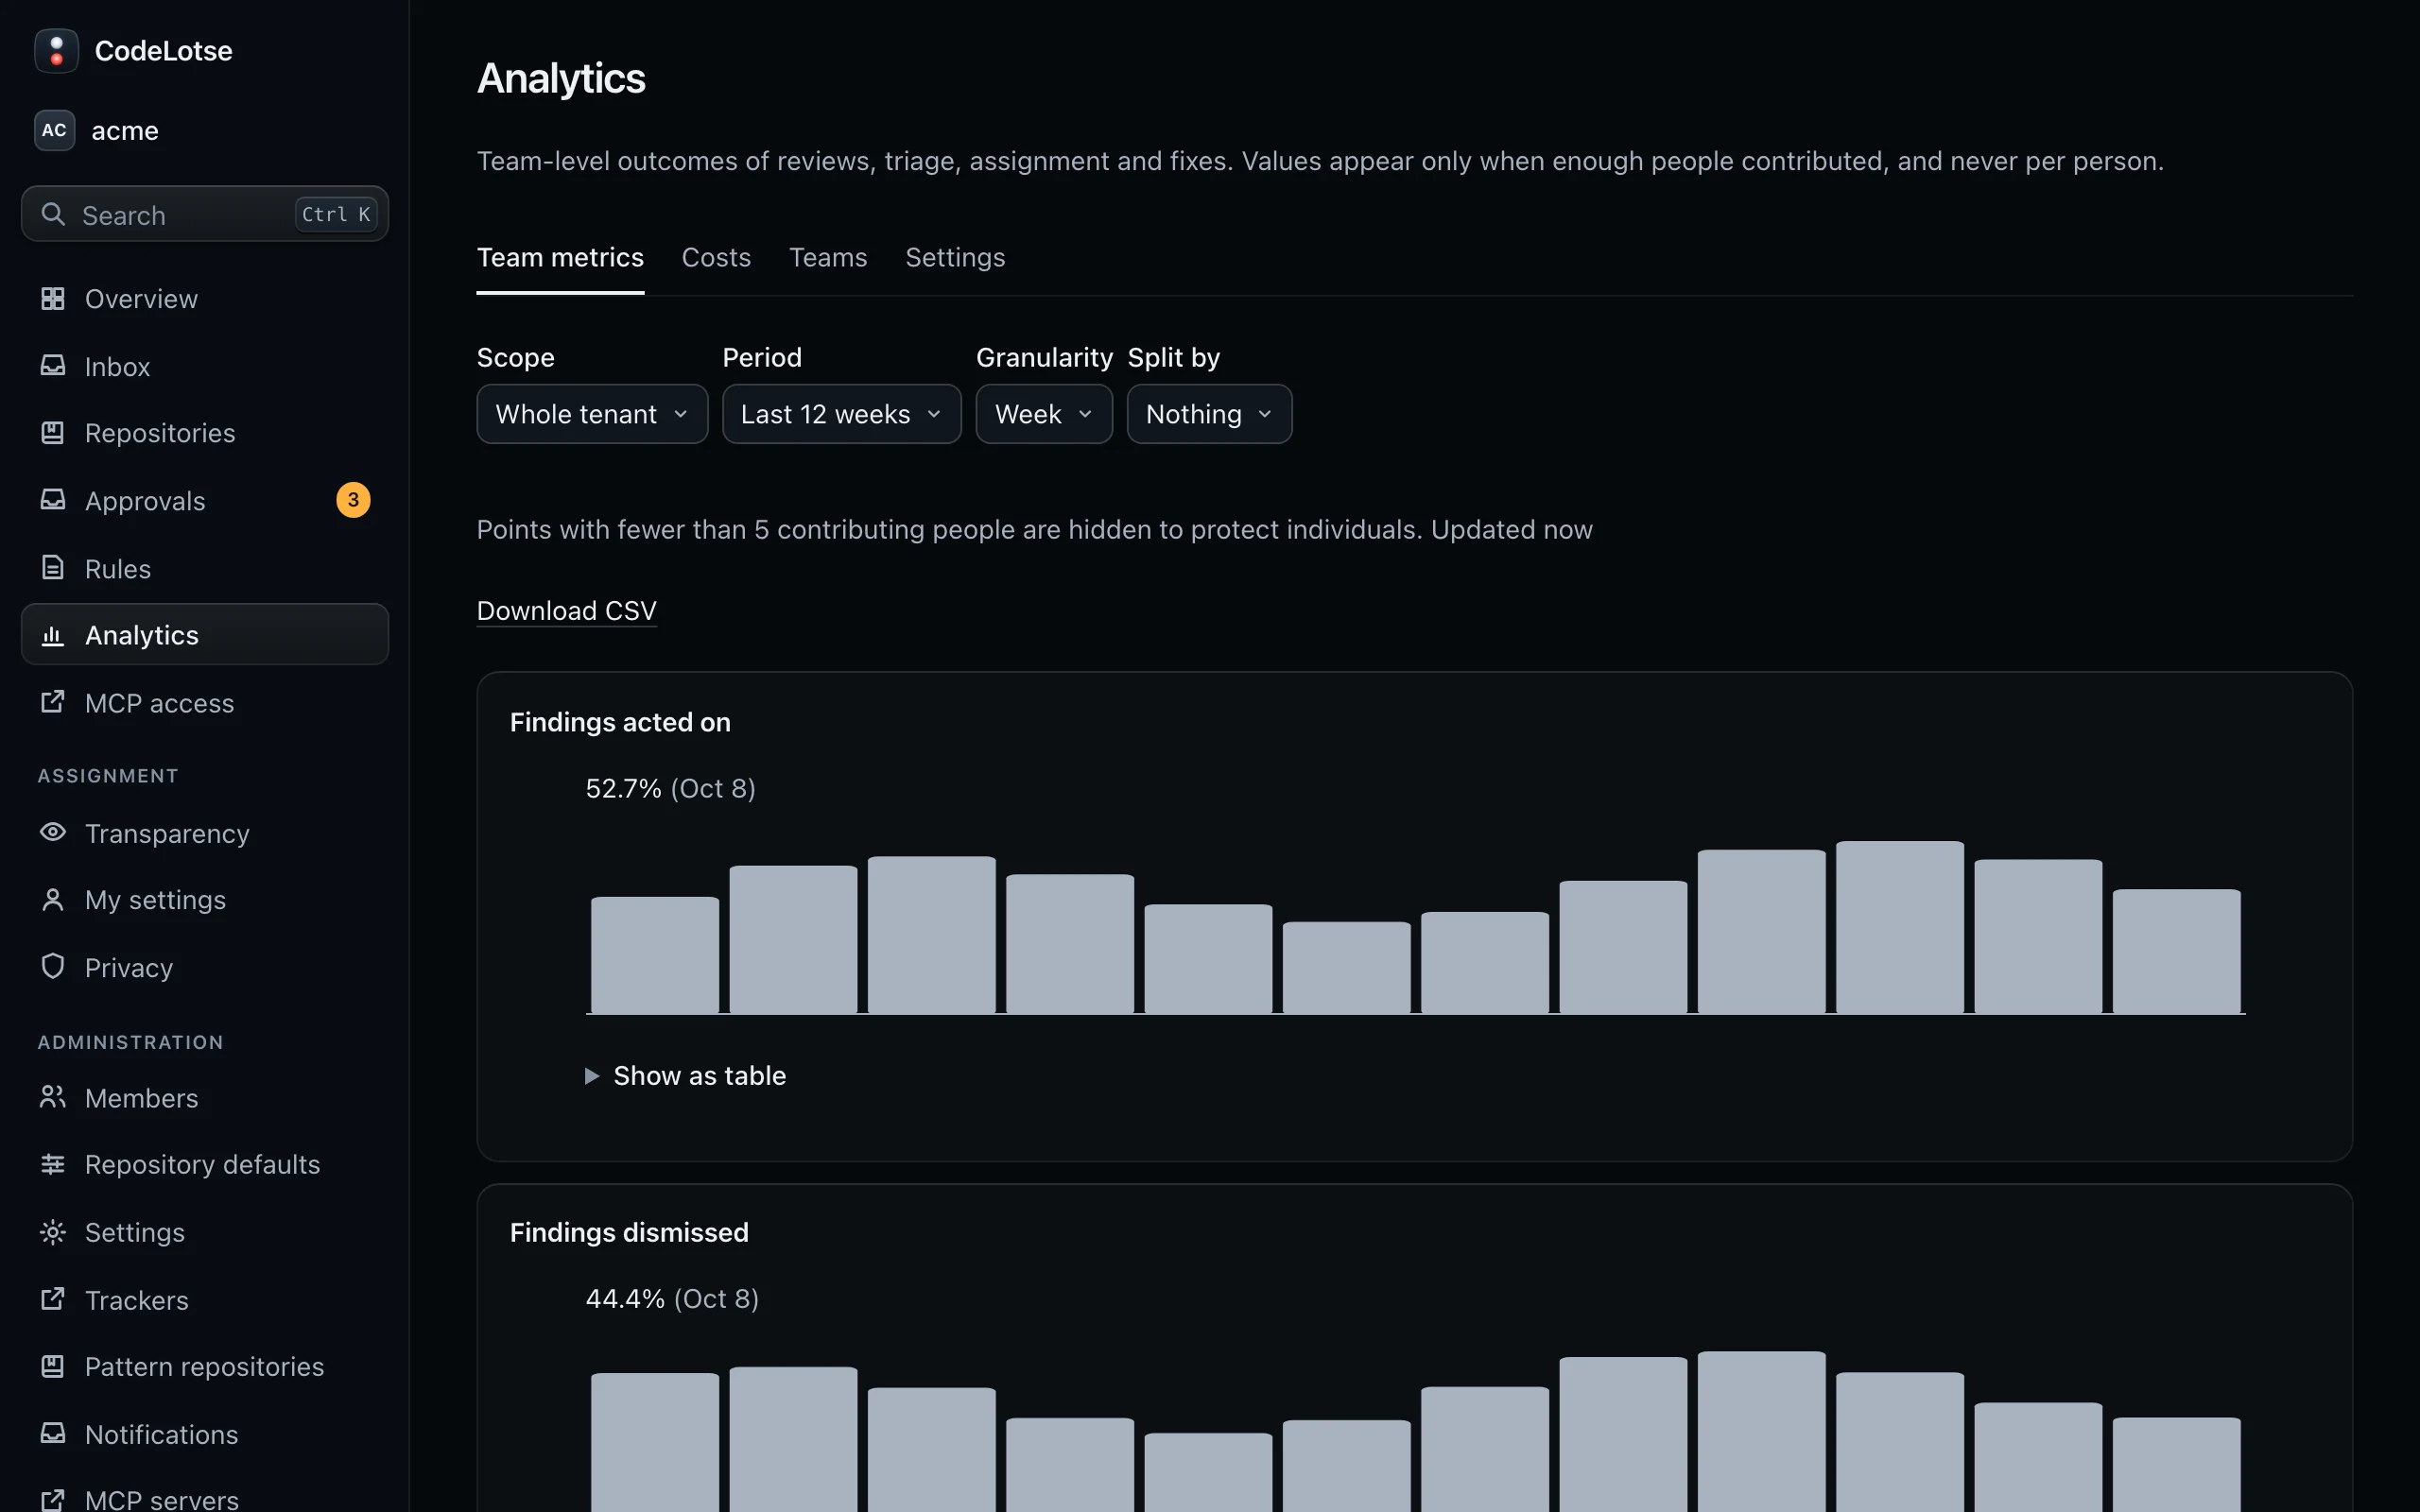
Open Analytics › Team metrics (or a repository's Analytics tab) and choose:
- Scope: Whole tenant, a team or one repository;
- Period: the last 4, 12, 26 or 52 weeks;
- Granularity: Day, Week or Month;
- Split by: for example Category, Severity, Feature or Model, where the metric supports it.
| Metric | Meaning |
|---|---|
| Findings acted on | Share of findings people acted on, for example by changing the code or committing a suggestion, of all findings with a response |
| Findings dismissed | Share of findings people dismissed, of the same findings |
| Comments per reviewed pull request | Posted comments per reviewed pull request |
| Silent reviews | Share of reviews that posted nothing |
| Published findings | Findings posted to the code host |
| Time to first review, Time to merge | Durations with mean, median and 90th percentile |
| Triage labels kept | Share of applied labels people kept |
| Duplicate issues found | Triage runs that named at least one duplicate |
| Assignment suggestions kept | Share of suggestions and applied assignments that were not changed |
| Fix pull requests merged | Share of published fixes that were merged |
| Model tokens, Model cost, Prompt cache hits | Usage and cost of model calls |
Every chart has Show as table, and Download CSV exports the values. The page shows when the numbers were last Updated; they are recomputed every hour.
Why some values are hidden ​
A value is shown only when at least as many people contributed to it as the organisation's minimum group size (5 by default). Otherwise the point shows Not enough people for team metrics and is left out of the CSV. This protects individuals in small teams. Bots never count.
Model costs are not about people and are always shown to those who may see them.
Costs and budgets ​
Analytics › Costs shows tokens, cost and prompt-cache hits of every model call, split by feature, model or tier. Calls that belong to no repository count towards the whole organisation only.
When spending reaches a threshold of a model budget (50, 80 and 100 % by default), administrators see a Budget alerts banner on the analytics and overview pages and can Acknowledge it. Budgets themselves are set in model routing.
Teams ​
A team groups repositories for analytics, for example all repositories of the payments team. People are never assigned to teams. Administrators create teams under Analytics › Teams with Create team and then choose a team as the scope.
Settings ​
Administrators set under Analytics › Settings:
| Setting | Meaning |
|---|---|
| Minimum group size | Between 5 and 50. Points with fewer contributing people are hidden. |
| Allow people to see their own metrics | Lets each person turn on My metrics for themselves. Nobody else can see personal metrics. Unavailable while team-level metrics only or works-council mode is on. |
| Budget alert thresholds | The shares of a budget that raise an alert. |
See your own metrics ​
When an administrator allows personal metrics, tick Show my open work in the workload view under Assignment › My settings. My metrics then appears in the sidebar with the same metrics for your own pull requests and issues. Only you can see them. People who signed in with a company account have no personal metrics.